


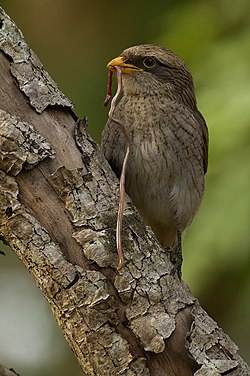

Yellow-billed Shrike
Corvinella corvina
Silhouette: PhyloPic · PhyloPic
- KingdomAnimalia (Animals)
- PhylumChordata (Chordates)
- ClassAves (Birds)
- OrderPasseriformes (Perching Birds)
- FamilyLaniidae (Shrikes)
- GenusCorvinella (Yellow-billed Shrikes)
- SpeciesCorvinella corvina (Yellow-billed Shrike)
About the Yellow-billed Shrike
The yellow-billed shrike (Corvinella corvina) is a large passerine bird in the shrike family. It is sometimes known as the long-tailed shrike, but this invites confusion with the long-tailed shrike, Lanius schach, of tropical southern Asia. It is the only species placed in the genus Corvinella. The yellow-billed shrike is a common resident breeding bird in tropical Africa from Senegal eastwards to Uganda and locally in westernmost Kenya. It frequents forest and other habitats with trees.
The yellow-billed shrike was formally described in 1809 as Lanius corvinus by the English naturalist George Shaw. The specific epithet is from Latin meaning "raven-like". Shaw based his account on "La Grande-pie-grieche" that had been described and illustrated in 1799 by the French naturalist François Levaillant. Levaillant had acquired a preserved specimen from a dealer and did not know its origin. In 1831 the French naturalist René Lesson introduced the genus Corvinella to accommodate the yellow-billed shrike and also designated the type location as Senegal. Based on the results of molecular genetic studies, this species has sometimes been placed in the genus Lanius, but the phylogenetic... Wikipedia →
Recent sightings of Yellow-billed Shrike in Kidepo Valley National Park
LIVEiNaturalistClosest Relatives at Kidepo Valley National Park

 Grey-backed Fiscal
Lanius excubitoroides

 Northern White-crowned Shrike
Eurocephalus ruppelli

Woodchat Shrike
Lanius senator

Northern Fiscal
Lanius humeralis

Isabelline Shrike
Lanius isabellinus

Lesser Grey Shrike
Lanius minor

Red-tailed Shrike
Lanius phoenicuroides

Teita Fiscal
Lanius dorsalis

 Piapiac
Ptilostomus afer

Red-cheeked Cordon-bleu
Uraeginthus bengalus

 Sooty Chat
Myrmecocichla nigra

 Rüppell's Glossy-starling
Lamprotornis purpuroptera
Global Distribution
Warmer areas are where this animal is recorded most often.
Parks Where Found
| # | Park | Country | Daily sighting probability |
|---|---|---|---|
| 1 | Kidepo Valley National Park | 🇺🇬 Uganda | |
| 2 | Niokolo-Koba National Park | 🇸🇳 Senegal | |
| 3 | Murchison Falls National Park | 🇺🇬 Uganda |
Quick answers
What are the chances of seeing a Yellow-billed Shrike in Kidepo Valley National Park?
About 70% of wildlife watchers report a Yellow-billed Shrike sighting in Kidepo Valley National Park, based on 311 verified sightings from GBIF citizen-science data.
When is the best time to see Yellow-billed Shrike in Kidepo Valley National Park?
December has the highest sighting rate for Yellow-billed Shrike in Kidepo Valley National Park in our monthly data.