Mana Pools National Park
🇿🇼 Zimbabwe
🐘 Elephants Stand Tall for Acacia PodsMana Pools National Park lies in northern Zimbabwe, on the flood‑plain of the Zambezi River. The park is a tropical savanna where river islands, grassy banks and scattered mopane woodlands create a mosaic of dry and wet habitats.
-15.902° S 29.526° E
Wildlife
⭐ Iconic Species
 ★
★  African Bush Elephant
Loxodonta africana
 ★
★  Painted Hunting Dog
Lycaon pictus
 ★
★  Common Hippopotamus
Hippopotamus amphibius
 ★
★  Lion
Lion
Panthera leo
📊 Most Spotted

 Emerald-spotted Wood-Dove
Turtur chalcospilos

 Meves's Glossy-starling
Lamprotornis mevesii

 Cape Turtle Dove
Streptopelia capicola

White-fronted Bee-eater
Merops bullockoides

 Southern Red-billed Hornbill
Tockus rufirostris

 Helmeted Guineafowl
Numida meleagris

 Egyptian Goose
Alopochen aegyptiaca

 Waterbuck
Kobus ellipsiprymnus

 Impala
Aepyceros melampus

 Common Warthog
Phacochoerus africanus

 Nile Crocodile
Crocodylus niloticus

 Fork-tailed Drongo
Dicrurus adsimilis
⭐ Iconic Species
★ African Bush Elephant
Loxodonta africana
★ Painted Hunting Dog
Lycaon pictus
★ Common Hippopotamus
Hippopotamus amphibius
★ Lion
Panthera leo
📊 Most Spotted
Waterbuck
Kobus ellipsiprymnus
Impala
Aepyceros melampus
Common Warthog
Phacochoerus africanus

 African Buffalo
Syncerus caffer

 Greater Kudu
Tragelaphus strepsiceros

 Chacma Baboon
Papio ursinus

 Vervet Monkey
Chlorocebus pygerythrus

 Smith's Bush Squirrel
Paraxerus cepapi

 Leopard
Panthera pardus

 Plains Zebra
Equus quagga

Northern Bushbuck
Tragelaphus scriptus

 Common Eland
Taurotragus oryx
📊 Most Spotted
Emerald-spotted Wood-Dove
Turtur chalcospilos
Meves's Glossy-starling
Lamprotornis mevesii
Cape Turtle Dove
Streptopelia capicola
White-fronted Bee-eater
Merops bullockoides
Southern Red-billed Hornbill
Tockus rufirostris
Helmeted Guineafowl
Numida meleagris
Egyptian Goose
Alopochen aegyptiaca
Fork-tailed Drongo
Dicrurus adsimilis

 Common Bulbul
Pycnonotus barbatus

 Lilac-breasted Roller
Coracias caudatus

Tropical Boubou
Laniarius major

Blue-breasted Cordonbleu
Uraeginthus angolensis
📊 Most Spotted
Nile Crocodile
Crocodylus niloticus

 Nile Monitor
Varanus niloticus

 Wahlberg’s Striped Skink
Trachylepis wahlbergii

 Fischer's Thick-toed Gecko
Chondrodactylus laevigatus

 Chobe Dwarf Gecko
Lygodactylus chobiensis

 Spotted Bush Snake
Philothamnus semivariegatus

 Leopard Tortoise
Stigmochelys pardalis

 Pointed Thick-toed Gecko
Pachydactylus punctatus

Cape Dwarf Gecko
Lygodactylus capensis
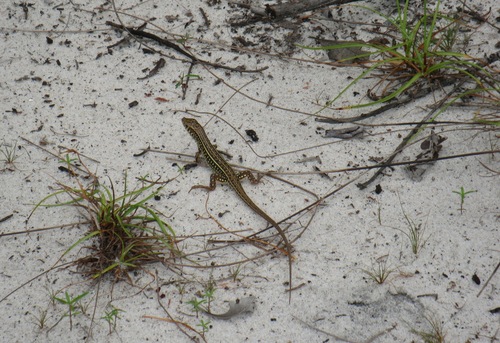
 Eastern Black-lined Plated Lizard
Gerrhosaurus intermedius

 Snouted Cobra
Naja annulifera

 Serrated Hinged Terrapin
Pelusios sinuatus
📊 Most Spotted

 Grey Foam-nest Treefrog
Chiromantis xerampelina

 Anchieta's Ridged Frog
Ptychadena anchietae

 Giant bullfrog
Pyxicephalus adspersus

Edible bullfrog
Pyxicephalus edulis

 African Split-skin Toad
Schismaderma carens

 Power's Rain Frog
Breviceps poweri

 Shovel-nosed Frog
Hemisus marmoratus

Red-Banded Rubber Frog
Phrynomantis bifasciatus

Sharp-nosed ridged frog
Ptychadena oxyrhynchus

Marbled sand frog
Tomopterna marmorata
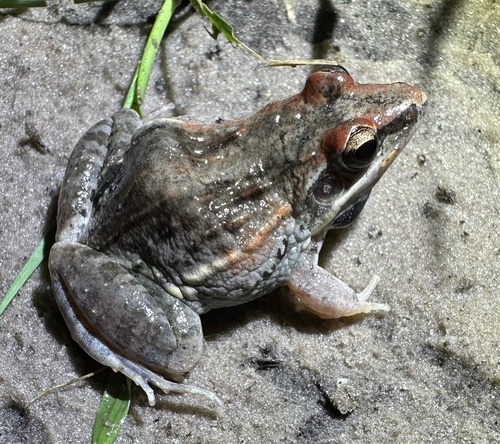
Mozambique ridged frog
Ptychadena mossambica

Guinea Snout-burrower
Hemisus guineensis
Recent sightings in Mana Pools National Park
LIVEiNaturalistAnimal Events
1Elephant Pod Foraging
During the dry winter months, elephants gather in the Faidherbia albida forests to feed on protein-rich fallen pods, often standing on their hind legs to reach branches.
2Wild Dog Denning Season
The dry season aligns with the wild dog denning period, offering exceptional opportunities to observe packs caring for their pups in the open riverine terrain.
3Spotted Hyena and Predator Activity
As water sources recede, predator interactions peak around shrinking pools, bringing hyenas and big cats into high-frequency contact along the floodplain.


Sighting Calendar
Average chance of spotting the park's most-spotted species, month by month
- 1Elephant Pod Foraging
- 2Wild Dog Denning Season
- 3Spotted Hyena and Predator Activity
Sighting Zones
Warmer areas are where all species together are recorded most often.
Essentials
Climate
What visitors saw
My most memorable Mana moments were on foot – with Boswell the bull elephant (see video here>>>) and when we approached a pride of lion on foot – that was exciting.
We have spent lots of time here in Mana Pools searching for wild dogs and searching for leopards — sadly, we never saw either (though we did see two leopards in Botswana for those who are following!) The wild dogs apparently abandoned their den fairly recently after two of the pups were killed by hyenas.
We found plenty of elephants, crocodiles on a hippo kill, and even a sighting of Mana Pools' most favorite resident, Boswell.
Right away we saw elephant, impala and zebra as we drove our way to Nyamepi, the public campsite and site of park HQ.
Quick answers
What animals can you see in Mana Pools National Park?
The most likely sightings are African Bush Elephant (seen by about 80% of wildlife watchers), Emerald-spotted Wood-Dove (seen by about 70% of wildlife watchers), Meves's Glossy-starling (seen by about 70% of wildlife watchers), Cape Turtle Dove (seen by about 70% of wildlife watchers), White-fronted Bee-eater (seen by about 70% of wildlife watchers) — among 1189 recorded vertebrate species, based on citizen-science data from GBIF.
When is the best time to visit Mana Pools National Park for wildlife?
July has the highest combined sighting rate for the park's top species in our month-by-month GBIF data. The full sighting calendar on this page shows each species' best months.
Can you see African Bush Elephant in Mana Pools National Park?
Yes — about 80% of wildlife watchers report a African Bush Elephant sighting in Mana Pools National Park, based on 125 verified sightings from GBIF citizen-science data.
Can you see Painted Hunting Dog in Mana Pools National Park?
Yes — about 50% of wildlife watchers report a Painted Hunting Dog sighting in Mana Pools National Park, based on 23 verified sightings from GBIF citizen-science data.
Can you see Common Hippopotamus in Mana Pools National Park?
Yes — about 70% of wildlife watchers report a Common Hippopotamus sighting in Mana Pools National Park, based on 51 verified sightings from GBIF citizen-science data.
Can you see Lion in Mana Pools National Park?
Yes — about 60% of wildlife watchers report a Lion sighting in Mana Pools National Park, based on 36 verified sightings from GBIF citizen-science data.
Where Wildlife Score
How good is this park for seeing wildlife?Biodiversity
Very goodHow rich is the wildlife?
Sighting
ExcellentHow likely to see animals?
Experience
ExcellentHow easy and pleasant is the visit?


