


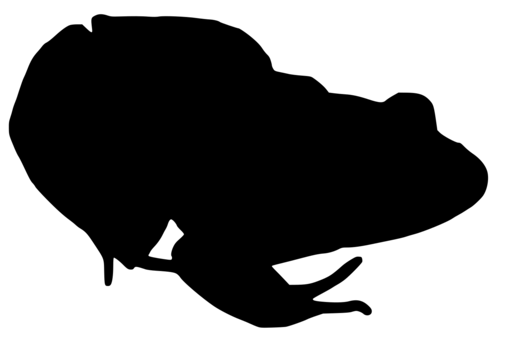
Northern Red-legged Frog
Rana aurora
Silhouette: Michael Scroggie, from original photograph by John Bettaso, USFWS (original photograph in public domain). · PhyloPic
- KingdomAnimalia (Animals)
- PhylumChordata (Chordates)
- ClassAmphibia (Amphibians)
- OrderAnura (Frogs and Toads)
- FamilyRanidae (Typical Frogs)
- GenusRana (Pond Frogs)
- SpeciesRana aurora (Northern Red-legged Frog)
About the Northern Red-legged Frog
Northern red-legged frogs (Rana aurora) are an amphibian species in the true frog family. They have greenish- to reddish-brown skin, red hind legs, dark spots across their backs, and dark facial masks. As a member of the genus Rana, this species is considered a true frog, with characteristic smooth skin and a narrow waist. These frogs are distributed along the Pacific coast of the United States and Canada, from Northern California to southwest British Columbia. There is some range overlap with the federally protected California red-legged frog. Northern red-legged frogs generally breed from January to March, laying eggs in water with submerged vegetation.
Northern red-legged frogs have decreasing population sizes and are listed as "Least Concern" by IUCN. They are a conservation strategy species in Oregon. These frogs are negatively affected by roads due to their characteristic breeding migration from upland-terrestrial to aquatic habitat. Excessive road fatalities have led to novel volunteer programs and wildlife undercrossing projects to protect urban frog populations in Portland, Oregon.
Northern red-legged frogs' genus and species name is Rana aurora. They are in... Wikipedia →
Recent sightings of Northern Red-legged Frog in Redwood National Park
LIVEiNaturalist


Global Distribution
Warmer areas are where this animal is recorded most often.
Parks Where Found
| # | Park | Country | Daily sighting probability |
|---|---|---|---|
| 1 | Redwood National Park | 🇺🇸 United States | |
| 2 | Pacific Rim National Park Reserve | 🇨🇦 Canada | |
| 3 | Great Bear Rainforest | 🇨🇦 Canada | |
| 4 | Olympic National Park | 🇺🇸 United States |
Quick answers
What are the chances of seeing a Northern Red-legged Frog in Redwood National Park?
About 60% of wildlife watchers report a Northern Red-legged Frog sighting in Redwood National Park, based on 312 verified sightings from GBIF citizen-science data.
When is the best time to see Northern Red-legged Frog in Redwood National Park?
September has the highest sighting rate for Northern Red-legged Frog in Redwood National Park in our monthly data.