



Shadow Chipmunk
Tamias senex
Silhouette: Chloé Schmidt · PhyloPic
- KingdomAnimalia (Animals)
- PhylumChordata (Chordates)
- ClassMammalia (Mammals)
- OrderRodentia (Rodents)
- FamilySciuridae (Squirrels)
- GenusTamias (Eastern Chipmunks)
- SpeciesTamias senex (Shadow Chipmunk)
About the Shadow Chipmunk
Allen's chipmunk (Neotamias senex), also known as the shadow chipmunk, is a species of chipmunk native to the western United States. Occurring in California, Oregon, and Nevada, it is a common species of the Sierra Nevada.
Allen's chipmunk's total length measures about 229–261 mm (9.0–10.3 in), with a tail length of 90–111 mm (3.5–4.4 in). Adults weigh 66.8–108.5 g (2.36–3.83 oz), with females being larger than males on average as the species exhibits a dimorphism ration of 1.033. The coastal subspecies (Neotamias senex pacifica) is characterized by an overall dark fur complexion with indistinct dorsal stripes, similar to that of Neotamias townsendii. The inland subspecies (Neotamias senex senex) have a much lighter complexion, with brownish-yellow fur tinged with smoky gray. During the summer and winter, it displays a distinctive black median dorsal stripe along its back.
The coastal subspecies is found solely in the redwood forest belt of California that extends from the Pacific coast to about 32 km (20 mi) inland, and ranges from the Eel River of Humboldt County in the south to the Klamath River of Del Norte County in the north. The inland subspecies... Wikipedia →
Recent sightings of Shadow Chipmunk in Redwood National Park
LIVEiNaturalistClosest Relatives at Redwood National Park

 Sonoma Chipmunk
Tamias sonomae

 Douglas' Squirrel
Tamiasciurus douglasii

 Western Gray Squirrel
Sciurus griseus

 Fox Squirrel
Sciurus niger

 Deer Mouse
Peromyscus maniculatus

 American Beaver
Castor canadensis

 Sonoma Tree Vole
Arborimus pomo

 Mountain Beaver
Aplodontia rufa

Red Tree Vole
Arborimus longicaudus

 Western Red-backed Vole
Myodes californicus

Dusky-footed Woodrat
Neotoma fuscipes
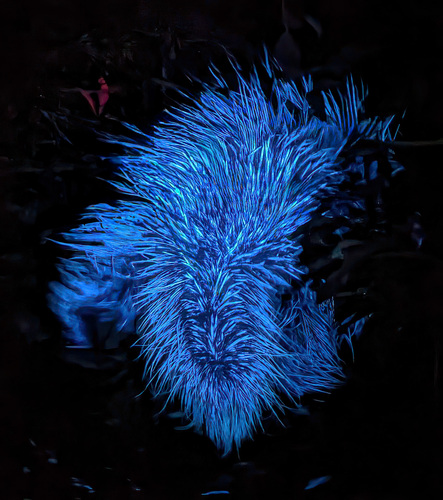
 Quiller
Erethizon dorsatus
Global Distribution
Warmer areas are where this animal is recorded most often.
Parks Where Found
| # | Park | Country | Daily sighting probability |
|---|---|---|---|
| 1 | Redwood National Park | 🇺🇸 United States |
More parks will be added in future updates.
Quick answers
What are the chances of seeing a Shadow Chipmunk in Redwood National Park?
About 30% of wildlife watchers report a Shadow Chipmunk sighting in Redwood National Park, based on 62 verified sightings from GBIF citizen-science data.
When is the best time to see Shadow Chipmunk in Redwood National Park?
August has the highest sighting rate for Shadow Chipmunk in Redwood National Park in our monthly data.