



Yellow-bellied Marmot
Marmota flaviventris
Silhouette: T. Michael Keesey · PhyloPic
- KingdomAnimalia (Animals)
- PhylumChordata (Chordates)
- ClassMammalia (Mammals)
- OrderRodentia (Rodents)
- FamilySciuridae (Squirrels)
- GenusMarmota (Marmots)
- SpeciesMarmota flaviventris (Yellow-bellied Marmot)
About the Yellow-bellied Marmot
The yellow-bellied marmot (Marmota flaviventer), also known as the rock chuck, is a large, stout-bodied ground squirrel in the marmot genus. It is one of fourteen species of marmots, and is native to mountainous and semi-arid regions of southwestern Canada and western United States, including the Rocky Mountains, Sierra Nevada, and the Great Basin, often (but not exclusively) living above 2,000 metres (6,500 feet). The fur is mainly brown, with a dark bushy tail, yellow chest and white patch between the eyes, and they weigh up to approximately 5 kilograms (11 pounds). They are highly social creatures, living in burrows in colonies of up to twenty individuals. They are diurnal and feed on plant material, insects, and bird eggs. They hibernate for approximately eight months starting in September and lasting through the winter. They have an average lifespan of 15 years.
Yellow-bellied marmots usually weigh from 1.6–5.2 kg (3 lb 8 oz – 11 lb 7 oz) when fully grown, though males typically weigh more than females. The weight fluctuates quite drastically through the year, with the least measured in early spring and the most measured in early autumn. Adult males typically... Wikipedia →
Recent sightings of Yellow-bellied Marmot in Yellowstone National Park
LIVEiNaturalistClosest Relatives at Yellowstone National Park

 Uinta Ground Squirrel
Urocitellus armatus

 Golden-mantled Ground Squirrel
Callospermophilus lateralis

 American Red Squirrel
Tamiasciurus hudsonicus

 Least Chipmunk
Tamias minimus

Yellow-pine Chipmunk
Tamias amoenus

Uinta Chipmunk
Tamias umbrinus

 Northern Flying Squirrel
Glaucomys sabrinus

 Muskrat
Ondatra zibethicus

 American Beaver
Castor canadensis
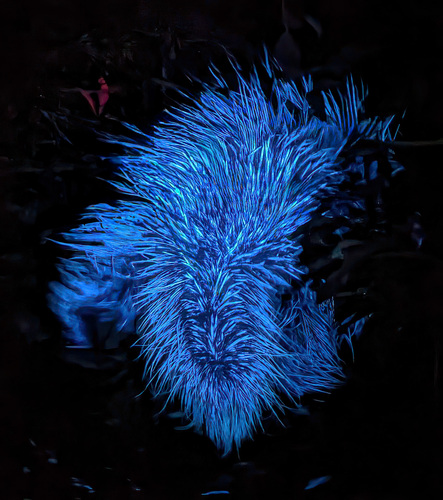
 Quiller
Erethizon dorsatus

 Northern Pocket Gopher
Thomomys talpoides

 Bushy-tailed Wood Rat
Neotoma cinerea
Global Distribution
Warmer areas are where this animal is recorded most often.
Parks Where Found
| # | Park | Country | Daily sighting probability |
|---|---|---|---|
| 1 | Yosemite National Park | 🇺🇸 United States |
More parks will be added in future updates.
Quick answers
What are the chances of seeing a Yellow-bellied Marmot in Yellowstone National Park?
About 50% of wildlife watchers report a Yellow-bellied Marmot sighting in Yellowstone National Park, based on 535 verified sightings from GBIF citizen-science data.
When is the best time to see Yellow-bellied Marmot in Yellowstone National Park?
April has the highest sighting rate for Yellow-bellied Marmot in Yellowstone National Park in our monthly data.