Litchfield National Park
🇦🇺 Australia
🦎 Mertens's Water Monitor's Secret PoolsLitchfield National Park is a tropical savanna protected area situated just south of Darwin in Australia's Top End. This landscape features grassy woodlands, sandstone plateaus, and permanent spring-fed waterfalls. Unlike the seasonally dry floodplains found elsewhere in the region, Litchfield is famous for its accessible plunge pools and dense network of walking tracks winding through open eucalypt forests.
-13.167° S 130.780° E
Wildlife
⭐ Iconic Species
 ★
★  Mertens's Water Monitor
Varanus mertensi
 ★
★  Great Bowerbird
Chlamydera nuchalis
 ★
★  Black Flying-fox
Pteropus alecto
📊 Most Spotted

 Torresian Crow
Corvus orru

 Bar-shouldered Dove
Geopelia humeralis

 White-bellied Cuckooshrike
Coracina papuensis

 Sulphur-crested Cockatoo
Cacatua galerita

 Blue-winged Kookaburra
Dacelo leachii

 Red-collared Lorikeet
Trichoglossus rubritorquis

 Spangled Drongo
Dicrurus bracteatus

Peaceful Dove
Geopelia placida

 Bauxite Rainbow Skink
Carlia amax

Lowlands Plain-backed Ctenotus
Ctenotus essingtonii

 Agile Wallaby
Macropus agilis

 Brown Tree Snake
Boiga irregularis
⭐ Iconic Species
📊 Most Spotted
Agile Wallaby
Macropus agilis

Antilopine Kangaroo
Macropus antilopinus

Little Red Flying Fox
Pteropus scapulatus

 Black-footed Tree Rat
Mesembriomys gouldii

 Common Brushtail
Trichosurus vulpecula

 Delicate Mouse
Pseudomys delicatulus
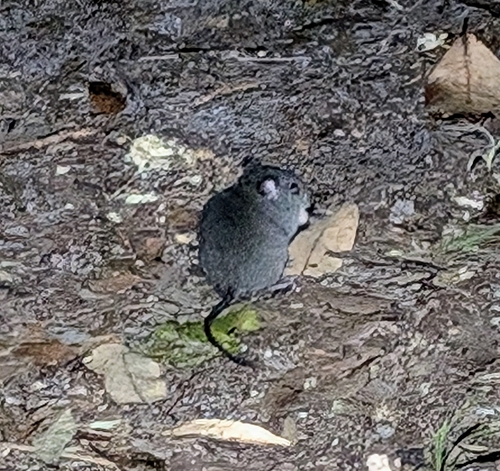
Grassland Melomys
Melomys burtoni

 Short-beaked Echidna
Tachyglossus aculeatus

 Hoary Wattled Bat
Chalinolobus nigrogriseus

Dusky Roundleaf Bat
Hipposideros ater

 Northern Brown Bandicoot
Isoodon macrourus

 Sandstone Dibbler
Pseudantechinus bilarni
⭐ Iconic Species
📊 Most Spotted
Torresian Crow
Corvus orru
Bar-shouldered Dove
Geopelia humeralis
White-bellied Cuckooshrike
Coracina papuensis
Sulphur-crested Cockatoo
Cacatua galerita
Blue-winged Kookaburra
Dacelo leachii
Red-collared Lorikeet
Trichoglossus rubritorquis
Spangled Drongo
Dicrurus bracteatus
Peaceful Dove
Geopelia placida

Varied Triller
Lalage leucomela

 Blue-faced Honeyeater
Entomyzon cyanotis

Whistling Kite
Haliastur sphenurus

 Black Kite
Milvus migrans
⭐ Iconic Species
📊 Most Spotted
Bauxite Rainbow Skink
Carlia amax
Lowlands Plain-backed Ctenotus
Ctenotus essingtonii
Brown Tree Snake
Boiga irregularis

 Burton's Legless Lizard
Lialis burtonis

Black-headed Python
Aspidites melanocephalus

Rough-scaled Death Adder
Acanthophis rugosus

Olive Python
Liasis olivaceus

 Gilbert's Dragon
Lophognathus gilberti

Lined Firetail Skink
Morethia ruficauda

 Common Prickly Gecko
Heteronotia binoei

Children's Python
Antaresia childreni

Mair's Keelback
Tropidonophis mairii
📊 Most Spotted

 Rockhole Frog
Litoria meiriana

 Eastern Cane Toad
Rhinella marina

Desert Tree Frog
Litoria rubella

Watjulum Frog
Litoria watjulumensis

Australian Rocket Frog
Litoria nasuta

 Ranoidea caerulea
Ranoidea caerulea

Copland's Rock Frog
Litoria coplandi

 Ornate Burrowing Frog
Platyplectrum ornatum

 Marbled Frog
Limnodynastes convexiusculus

giant frog
Ranoidea australis
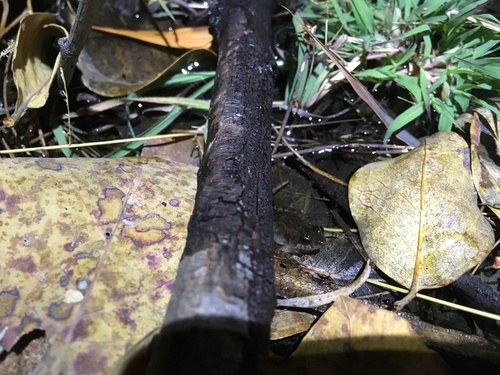
Bilingual Frog
Crinia bilingua

Woodworker Frog
Limnodynastes lignarius
Recent sightings in Litchfield National Park
LIVEiNaturalistAnimal Events
1Frill-necked Lizard mating displays
Male frill-necked lizards perform dramatic territorial and mating displays, extending their frills and hissing to deter rivals or attract females.


2Agile Wallaby congregations at waterholes
Hundreds of agile wallabies gather at permanent waterholes during the dry season, creating a unique wildlife spectacle.
3Black Flying-fox evening fly-outs
Thousands of black flying-foxes emerge from roosts in monsoon forests at dusk, creating a cacophony of calls and a dark cloud in the sky.
Sighting Calendar
Average chance of spotting the park's most-spotted species, month by month
- 1Frill-necked Lizard mating displays
- 2Agile Wallaby congregations at waterholes
- 3Black Flying-fox evening fly-outs
Sighting Zones
Warmer areas are where all species together are recorded most often.
Essentials
Climate
What visitors saw
Going against the norm, we had to walk down to this waterfall, not up, and on the way down we could see people getting ready to jump in. - On the way to Florence Falls - And down we go - Our first Pacific Emearald-Dove Finally, we went to Buley Rockholes, this was super fun.
Having seen some crocodiles as we cruised the Kimberley, I guess I was expecting a quiet half-hour pottering up and down the river spotting crocodiles.
We saw some of the invasive cane toads, a kingfisher, and many different types of spiders: a fairly large wolf spider on the forest floor, one that resembled our cross spider hanging down from above, and another large but slender orb-weaver spider.
Quick answers
What animals can you see in Litchfield National Park?
The most likely sightings are Mertens's Water Monitor (seen by about 90% of wildlife watchers), Torresian Crow (seen by about 70% of wildlife watchers), Bar-shouldered Dove (seen by about 70% of wildlife watchers), White-bellied Cuckooshrike (seen by about 70% of wildlife watchers), Black Flying-fox (seen by about 60% of wildlife watchers) — among 605 recorded vertebrate species, based on citizen-science data from GBIF.
When is the best time to visit Litchfield National Park for wildlife?
August has the highest combined sighting rate for the park's top species in our month-by-month GBIF data. The full sighting calendar on this page shows each species' best months.
Can you see Mertens's Water Monitor in Litchfield National Park?
Yes — about 90% of wildlife watchers report a Mertens's Water Monitor sighting in Litchfield National Park, based on 157 verified sightings from GBIF citizen-science data.
Can you see Great Bowerbird in Litchfield National Park?
Yes — about 40% of wildlife watchers report a Great Bowerbird sighting in Litchfield National Park, based on 202 verified sightings from GBIF citizen-science data.
Can you see Black Flying-fox in Litchfield National Park?
Yes — about 60% of wildlife watchers report a Black Flying-fox sighting in Litchfield National Park, based on 66 verified sightings from GBIF citizen-science data.
Where Wildlife Score
How good is this park for seeing wildlife?Biodiversity
GoodHow rich is the wildlife?
Sighting
Very goodHow likely to see animals?
Experience
Very goodHow easy and pleasant is the visit?

