Uluru-Kata Tjuta National Park
🇦🇺 Australia
🦎 Thorny Devils on Red SandUluru-Kata Tjuta National Park is a desert and dry scrub reserve situated in the red center of Australia. This protected expanse is defined by ancient sandstone monoliths and towering domes rising sharply from flat, arid plains, setting it apart from standard coastal or woodland reserves.
-25.341° S 130.742° E
Wildlife
⭐ Iconic Species
 ★
★  Long-nosed Water Dragon
Gowidon longirostris
 ★
★  Dromedary Camel
Camelus dromedarius
 ★
★  Gould's Goanna
Varanus gouldii
📊 Most Spotted

 Willie Wagtail
Rhipidura leucophrys

 White-plumed Honeyeater
Ptilotula penicillata

 Zebra Finch
Taeniopygia guttata

 Singing Honeyeater
Gavicalis virescens

 Crested Pigeon
Ocyphaps lophotes

Spiny-cheeked Honeyeater
Acanthagenys rufogularis

Yellow-throated Miner
Manorina flavigula

 Central Netted Ground-dragon
Ctenophorus nuchalis

 Black-faced Woodswallow
Artamus cinereus

 Australian Kestrel
Falco cenchroides

Gray Shrikethrush
Colluricincla harmonica

 Budgerigar
Melopsittacus undulatus
⭐ Iconic Species
📊 Most Spotted

 Spinifex Hopping Mouse
Notomys alexis

 Hairy-footed Dunnart
Sminthopsis hirtipes

 Desert Mouse
Pseudomys desertor

 Finlayson's Cave Bat
Vespadelus finlaysoni

 Wongai Ningaui
Ningaui ridei

Stripe-faced Dunnart
Sminthopsis macroura

 Brush-tailed Mulgara
Dasycercus blythi

Fat-tailed False Antechinus
Pseudantechinus macdonnellensis

 Red Fox
Vulpes vulpes

Sandy Inland Mouse
Pseudomys hermannsburgensis
📊 Most Spotted
Willie Wagtail
Rhipidura leucophrys
White-plumed Honeyeater
Ptilotula penicillata
Zebra Finch
Taeniopygia guttata
Singing Honeyeater
Gavicalis virescens
Crested Pigeon
Ocyphaps lophotes
Spiny-cheeked Honeyeater
Acanthagenys rufogularis
Yellow-throated Miner
Manorina flavigula
Black-faced Woodswallow
Artamus cinereus
Australian Kestrel
Falco cenchroides
Gray Shrikethrush
Colluricincla harmonica
Budgerigar
Melopsittacus undulatus

 Purple-backed Fairywren
Malurus assimilis
⭐ Iconic Species
📊 Most Spotted
Central Netted Ground-dragon
Ctenophorus nuchalis

Thorny Devil
Moloch horridus

 Smooth Knob-tail
Nephrurus laevissimus

Central Australian Earless Dragon
Tympanocryptis centralis

 Northern Spiny-tailed Gecko
Strophurus ciliaris
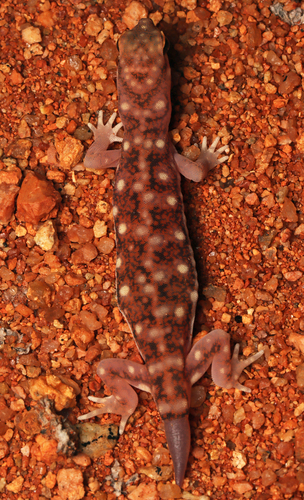
 Beaked Gecko
Rhynchoedura ornata

Common Knob-tailed Lizard
Nephrurus levis

 Black-headed Scaly Foot
Pygopus nigriceps

Military Dragon
Ctenophorus isolepis

 Perentie
Varanus giganteus

 Leopard Ctenotus
Ctenotus pantherinus

 Desert Fat-tailed Gecko
Diplodactylus laevis






Recent sightings in Uluru-Kata Tjuta National Park
LIVEiNaturalistAnimal Events
1Water Dragon Basking at Kuniya Walk
Long-nosed Water Dragons congregate at seasonal waterholes to bask and hunt, especially near Kuniya Walk where rock pools retain moisture.
2Camel Herds at Sunrise Viewing Areas
Dromedary Camels gather near sunrise viewing areas, often grazing on sparse vegetation around Uluru’s base before tourists arrive.
3Goanna Foraging After Rain
Gould’s Goannas emerge to forage actively after seasonal rains, digging for insects and small vertebrates in the softened soil.
Sighting Calendar
Average chance of spotting the park's most-spotted species, month by month
- 1Water Dragon Basking at Kuniya Walk
- 2Camel Herds at Sunrise Viewing Areas
- 3Goanna Foraging After Rain
Sighting Zones
Warmer areas are where all species together are recorded most often.
Essentials
Climate
What visitors saw
I managed to see were a Long-nosed dragon at Kata Tjuta and a Tree dtella at the campsite.
This was very fortunate because shortly before we left camp, I heard a cacatuid [member of the cockatoo family] flying over, and saw it landing on a dune crest.
Central netted dragon And then… my first real view of Uluṟu (even though I could technically see it a little it on the bus ride in).
Arriving at Kings Canyon Station, where we were staying in permanent tents on-site, we first stopped to see the camels!
Quick answers
What animals can you see in Uluru-Kata Tjuta National Park?
The most likely sightings are Willie Wagtail (seen by about 80% of wildlife watchers), White-plumed Honeyeater (seen by about 80% of wildlife watchers), Zebra Finch (seen by about 80% of wildlife watchers), Singing Honeyeater (seen by about 80% of wildlife watchers), Crested Pigeon (seen by about 70% of wildlife watchers) — among 546 recorded vertebrate species, based on citizen-science data from GBIF.
When is the best time to visit Uluru-Kata Tjuta National Park for wildlife?
December has the highest combined sighting rate for the park's top species in our month-by-month GBIF data. The full sighting calendar on this page shows each species' best months.
Can you see Long-nosed Water Dragon in Uluru-Kata Tjuta National Park?
Yes — about 70% of wildlife watchers report a Long-nosed Water Dragon sighting in Uluru-Kata Tjuta National Park, based on 125 verified sightings from GBIF citizen-science data.
Can you see Dromedary Camel in Uluru-Kata Tjuta National Park?
Yes — about 30% of wildlife watchers report a Dromedary Camel sighting in Uluru-Kata Tjuta National Park, based on 24 verified sightings from GBIF citizen-science data.
Can you see Gould's Goanna in Uluru-Kata Tjuta National Park?
Yes — about 50% of wildlife watchers report a Gould's Goanna sighting in Uluru-Kata Tjuta National Park, based on 59 verified sightings from GBIF citizen-science data.
Where Wildlife Score
How good is this park for seeing wildlife?Biodiversity
Very goodHow rich is the wildlife?
Sighting
GoodHow likely to see animals?
Experience
ExcellentHow easy and pleasant is the visit?


