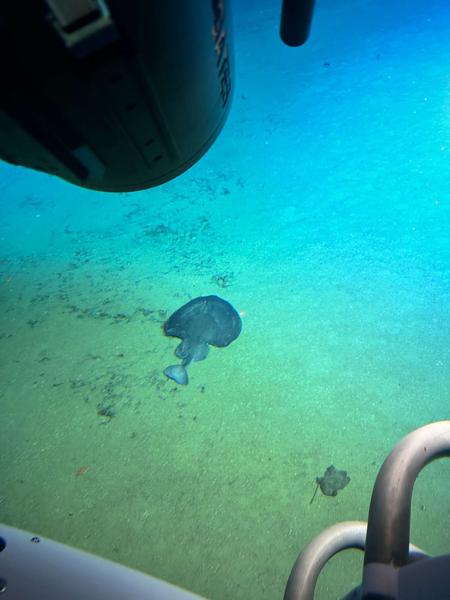

Chilean Torpedo
Tetronarce tremens
Silhouette: Ignacio Contreras · PhyloPic
- KingdomAnimalia (Animals)
- PhylumChordata (Chordates)
- ClassElasmobranchii
- OrderTorpediniformes (Electric Rays)
- FamilyTorpedinidae (Torpedoes)
- GenusTetronarce
- SpeciesTetronarce tremens (Chilean Torpedo)
11 Verified sightings at Galápagos Islands From 2019 to 2026
12 Verified sightings across all 2 parks From 2019 to 2026
November Best month highest sighting rate
☀️ Diurnal When it's spotted during daytime hours (6am–6pm)
About the Chilean Torpedo
Tetronarce tremens, commonly known as the Chilean torpedo, is a species of fish in the family Torpedinidae. It is found in Chile, Colombia, Costa Rica, Ecuador, and Peru. Its natural habitat is open seas. Wikipedia →
Recent sightings of Chilean Torpedo in Galápagos Islands
LIVEiNaturalistGlobal Distribution
Warmer areas are where this animal is recorded most often.
Parks Where Found
| # | Park | Country | Daily sighting probability |
|---|---|---|---|
| 1 | Galápagos Islands | 🇪🇨 Ecuador | |
| 2 | Isla del Coco National Park | 🇨🇷 Costa Rica |
Quick answers
What are the chances of seeing a Chilean Torpedo in Galápagos Islands?
About 10% of wildlife watchers report a Chilean Torpedo sighting in Galápagos Islands, based on 11 verified sightings from GBIF citizen-science data.
When is the best time to see Chilean Torpedo in Galápagos Islands?
November has the highest sighting rate for Chilean Torpedo in Galápagos Islands in our monthly data.