



Mertens's Water Monitor
Varanus mertensi
Silhouette: Steven Traver · PhyloPic
- KingdomAnimalia (Animals)
- PhylumChordata (Chordates)
- ClassSquamata
- FamilyVaranidae (Monitor Lizards)
- GenusVaranus (Monitor Lizards)
- SpeciesVaranus mertensi (Mertens's Water Monitor)
About the Mertens's Water Monitor
Mertens' water monitor (Varanus mertensi) is a species of monitor lizard in the family Varanidae. The species is native to northern Australia, and is a wide-ranging, actively foraging, opportunistic predator of aquatic and riparian habitats. It is named after German herpetologist Robert Mertens.
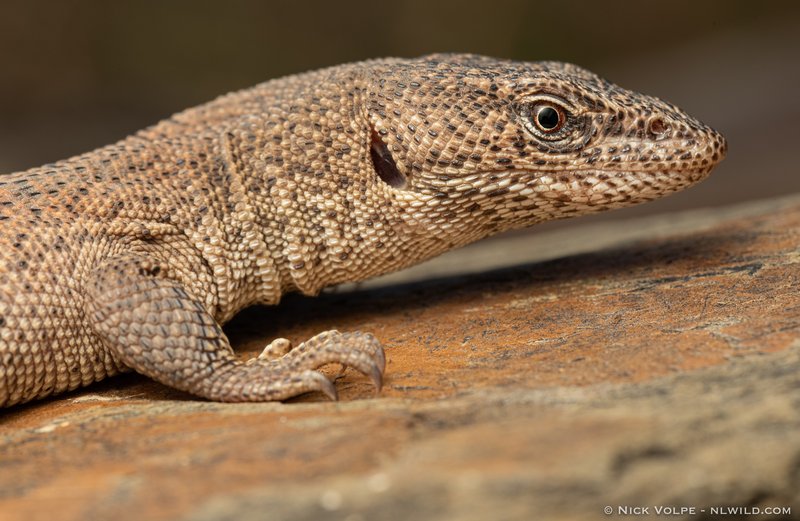
Mertens' water monitor grows to a total length (tail included) of about 2.0 m (6.6 ft). It is dark brown to black above, with many cream to yellow spots. The underparts are paler – white to yellowish – with grey mottling on the throat and blue-grey bars on the chest. The tail is strongly compressed laterally, with a high median dorsal keel, and is about 1.5 times the length of head and body.
Amongst all monitor species, including even the water monitors of the subgenus Soterosaurus, Mertens' water monitor is morphologically the most well adapted to an aquatic lifestyle, being able to seal its upwards facing nostrils when underwater. It is capable of swallowing prey underwater, which is an ability not reported in any other monitor species other than the Borneo earless monitor (Lanthanotus borneensis). It is also the only monitor species reported capable of using its sense... Wikipedia →
Recent sightings of Mertens's Water Monitor in Kakadu National Park
LIVEiNaturalistClosest Relatives at Kakadu National Park

 Argus Monitor
Varanus panoptes

Black-headed Monitor
Varanus tristis

 Gould's Goanna
Varanus gouldii

Black-spotted Ridge-tailed Monitor
Varanus insulanicus

Glauert's Monitor
Varanus glauerti

Black-palmed Rock Monitor
Varanus glebopalma

Mitchell's Water Monitor
Varanus mitchelli
Northern Blunt-spined Monitor
Varanus primordius

Banded Tree Monitor
Varanus scalaris
Global Distribution
Warmer areas are where this animal is recorded most often.
Parks Where Found
| # | Park | Country | Daily sighting probability |
|---|---|---|---|
| 1 | Litchfield National Park | 🇦🇺 Australia | |
| 2 | Nitmiluk National Park | 🇦🇺 Australia | |
| 3 | Kakadu National Park | 🇦🇺 Australia |
Quick answers
What are the chances of seeing a Mertens's Water Monitor in Kakadu National Park?
About 30% of wildlife watchers report a Mertens's Water Monitor sighting in Kakadu National Park, based on 27 verified sightings from GBIF citizen-science data.
When is the best time to see Mertens's Water Monitor in Kakadu National Park?
February has the highest sighting rate for Mertens's Water Monitor in Kakadu National Park in our monthly data.