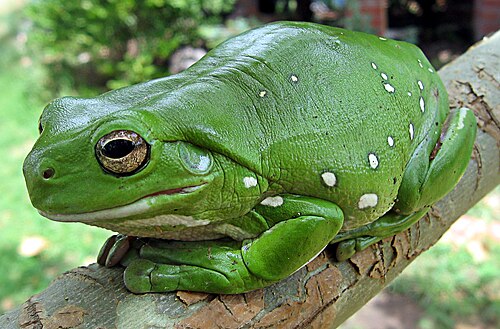



Ranoidea caerulea
Ranoidea caerulea
Silhouette: Vijay Karthick · PhyloPic
- KingdomAnimalia (Animals)
- PhylumChordata (Chordates)
- ClassAmphibia (Amphibians)
- OrderAnura (Frogs and Toads)
- FamilyPelodryadidae (Australasian Tree Frogs)
- GenusRanoidea
- SpeciesRanoidea caerulea
About the Ranoidea caerulea
The Australian green tree frog (Pelodryas caerulea), also known as simply green tree frog in Australia, White's tree frog, or dumpy tree frog, is a species of tree frog native to Australia and New Guinea, with introduced populations in the United States and New Zealand, though the latter is believed to have died out. It is morphologically similar to some other members of its family, particularly the magnificent tree frog (P. splendida) and the white-lipped tree frog (Sandyrana infrafrenata).
Larger than most Australian frogs, the Australian green tree frog reaches 10 cm (4 in) or more in length. Its average lifespan in captivity, about 16 years, is long compared with most frogs. Docile and well suited to living near human dwellings, Australian green tree frogs are often found on window sills or inside houses, eating insects drawn by the light. The green tree frog screams when it is in danger to scare off its foe, and squeaks when it is touched.
Due to its appearance and behavioural traits, the green tree frog is a popular exotic pet throughout the world. The skin secretions of the frog have antibacterial and antiviral properties that may prove useful in pharmaceutical preparations and which have rendered it relatively immune to the population declines being experienced by many species of amphibian. It is a common species and the International Union for Conservation of Nature has assessed its conservation status as being "least concern". Wikipedia →
Recent sightings of Ranoidea caerulea in Kakadu National Park
LIVEiNaturalistClosest Relatives at Kakadu National Park

 giant frog
Ranoidea australis

 Watjulum Frog
Litoria watjulumensis

Australian Rocket Frog
Litoria nasuta

Desert Tree Frog
Litoria rubella

Rockhole Frog
Litoria meiriana

Copland's Rock Frog
Litoria coplandi
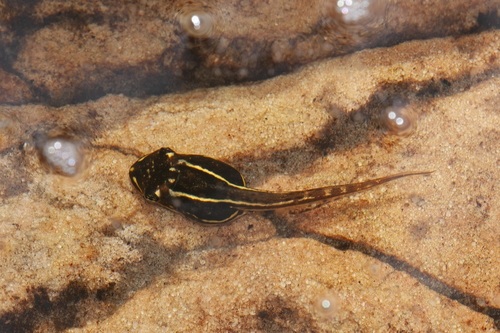
Masked Frog
Litoria personata

Tornier's Frog
Litoria tornieri

Peter's Frog
Litoria inermis

 Eastern Cane Toad
Rhinella marina

 Marbled Frog
Limnodynastes convexiusculus

Woodworker Frog
Limnodynastes lignarius
Global Distribution
Warmer areas are where this animal is recorded most often.
Parks Where Found
| # | Park | Country | Daily sighting probability |
|---|---|---|---|
| 1 | Litchfield National Park | 🇦🇺 Australia | |
| 2 | Kakadu National Park | 🇦🇺 Australia | |
| 3 | Nitmiluk National Park | 🇦🇺 Australia | |
| 4 | Lamington National Park | 🇦🇺 Australia | |
| 5 | Springbrook National Park | 🇦🇺 Australia | |
| 6 | Daintree National Park | 🇦🇺 Australia | |
| 7 | Noosa National Park | 🇦🇺 Australia | |
| 8 | Blue Mountains National Park | 🇦🇺 Australia |
Quick answers
What are the chances of seeing a Ranoidea caerulea in Kakadu National Park?
About 30% of wildlife watchers report a Ranoidea caerulea sighting in Kakadu National Park, based on 33 verified sightings from GBIF citizen-science data.
When is the best time to see Ranoidea caerulea in Kakadu National Park?
January has the highest sighting rate for Ranoidea caerulea in Kakadu National Park in our monthly data.