

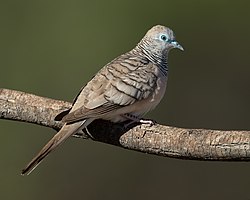



Peaceful Dove
Geopelia placida
Silhouette: Sheatherius · PhyloPic
- KingdomAnimalia (Animals)
- PhylumChordata (Chordates)
- ClassAves (Birds)
- OrderColumbiformes (Pigeons and Doves)
- FamilyColumbidae (Pigeons and Doves)
- GenusGeopelia (Australasian Doves)
- SpeciesGeopelia placida (Peaceful Dove)
About the Peaceful Dove
The peaceful dove (Geopelia placida) is a pigeon native to Australia and New Guinea. The peaceful dove is closely related to the zebra dove of south-east Asia and the barred dove of eastern Indonesia. Until recently, the three were classed as a single species, Geopelia striata, known as peaceful dove or zebra dove.
The bird is a relatively small pigeon and varies in length from 19 to 21 centimetres (7.6 to 8.4 inches). The peaceful dove has a pink-grey breast with chequered grey-brown wings. Thin striations of black appear around the neck and nape area and descend down the back. The eye is greyish-white and a blue-grey ring surrounds the eye that tapers off and joins the beak/cere. The juveniles are paler and less striated. They also have a duller eye ring. The nape is similar to that of the bar-shouldered dove in that the nape feathers are striated but differs in that the bar-shouldered dove does not have striated throat feathers like the peaceful dove. Furthermore, the nape feathers are grey-brown in colour compared to the vivid copper colour seen with bar-shouldered doves.
Calls of the peaceful dove are high-pitched "doodle-doo", "co-co-coo" and "croorrr!".... Wikipedia →
Recent sightings of Peaceful Dove in Nitmiluk National Park
LIVEiNaturalistClosest Relatives at Nitmiluk National Park

 Bar-shouldered Dove
Geopelia humeralis

Diamond Dove
Geopelia cuneata

 Crested Pigeon
Ocyphaps lophotes

 Common Bronzewing
Phaps chalcoptera

Torresian Imperial-Pigeon
Ducula spilorrhoa

Chestnut-quilled Rock-Pigeon
Petrophassa rufipennis

Partridge Pigeon
Geophaps smithii

Spinifex Pigeon
Geophaps plumifera
Global Distribution
Warmer areas are where this animal is recorded most often.
Parks Where Found
| # | Park | Country | Daily sighting probability |
|---|---|---|---|
| 1 | Kakadu National Park | 🇦🇺 Australia | |
| 2 | Nitmiluk National Park | 🇦🇺 Australia | |
| 3 | Litchfield National Park | 🇦🇺 Australia | |
| 4 | Flinders Ranges National Park | 🇦🇺 Australia | |
| 5 | Daintree National Park | 🇦🇺 Australia | |
| 6 | Ningaloo Marine Park | 🇦🇺 Australia | |
| 7 | Blue Mountains National Park | 🇦🇺 Australia | |
| 8 | Springbrook National Park | 🇦🇺 Australia | |
| 9 | Grampians National Park | 🇦🇺 Australia | |
| 10 | Lamington National Park | 🇦🇺 Australia | |
| 11 | Cape Range | 🇦🇺 Australia | |
| 12 | Uluru-Kata Tjuta National Park | 🇦🇺 Australia | |
| 13 | Kosciuszko National Park | 🇦🇺 Australia |
Quick answers
What are the chances of seeing a Peaceful Dove in Nitmiluk National Park?
About 60% of wildlife watchers report a Peaceful Dove sighting in Nitmiluk National Park, based on 300 verified sightings from GBIF citizen-science data.
When is the best time to see Peaceful Dove in Nitmiluk National Park?
April has the highest sighting rate for Peaceful Dove in Nitmiluk National Park in our monthly data.