Queen Elizabeth National Park
🇺🇬 Uganda
🐘 Elephants Along the Kazinga ChannelQueen Elizabeth is a tropical savanna reserve in western Uganda, spanning open grasslands, dense woodlands, and shallow crater lakes. Visitors walk through flat grassy tracks and shrubby acacia trails beneath the shadows of distant mountains.
-0.227° S 29.976° E
Wildlife
⭐ Iconic Species
 ★
★  Lion
Lion
Panthera leo
 ★
★  Common Hippopotamus
Hippopotamus amphibius
 ★
★  African Bush Elephant
Loxodonta africana
 ★
★  Nile Monitor
Varanus niloticus
📊 Most Spotted

 Kob
Kob
Kobus kob

 Waterbuck
Kobus ellipsiprymnus

 Speckled Mousebird
Colius striatus

 African Buffalo
Syncerus caffer

 Black-headed Gonolek
Laniarius erythrogaster

 Rüppell's Glossy-starling
Lamprotornis purpuroptera

 Common Bulbul
Pycnonotus barbatus

 White-browed Coucal
Centropus superciliosus

 Cape Turtle Dove
Streptopelia capicola

 Hamerkop
Scopus umbretta

 Common Warthog
Phacochoerus africanus

 Olive Baboon
Papio anubis
⭐ Iconic Species
★ Lion
Panthera leo
★ Common Hippopotamus
Hippopotamus amphibius
★ African Bush Elephant
Loxodonta africana
📊 Most Spotted
Kob
Kobus kob
Waterbuck
Kobus ellipsiprymnus
African Buffalo
Syncerus caffer
Common Warthog
Phacochoerus africanus
Olive Baboon
Papio anubis

 Giant Forest Hog
Hylochoerus meinertzhageni

 Tantalus Monkey
Chlorocebus tantalus

 Topi
Topi
Damaliscus korrigum

 Leopard
Panthera pardus

 Mantled Guereza
Colobus guereza

 Banded Mongoose
Mungos mungo

 Northern Bushbuck
Tragelaphus scriptus
📊 Most Spotted
Speckled Mousebird
Colius striatus
Black-headed Gonolek
Laniarius erythrogaster
Rüppell's Glossy-starling
Lamprotornis purpuroptera
Common Bulbul
Pycnonotus barbatus
White-browed Coucal
Centropus superciliosus
Cape Turtle Dove
Streptopelia capicola
Hamerkop
Scopus umbretta

 African Fish-Eagle
Haliaeetus vocifer

 Red-necked Francolin
Pternistis afer

 Pied Kingfisher
Ceryle rudis

 Grey-backed Fiscal
Lanius excubitoroides

Yellow-throated Longclaw
Macronyx croceus
⭐ Iconic Species
📊 Most Spotted

 Nile Crocodile
Crocodylus niloticus

 Uganda blue-headed tree agama
Acanthocercus ugandaensis

 Speckle-lipped Mabuya
Trachylepis maculilabris

 Montane side-striped chameleon
Trioceros ellioti

 African Rock Python
Python sebae
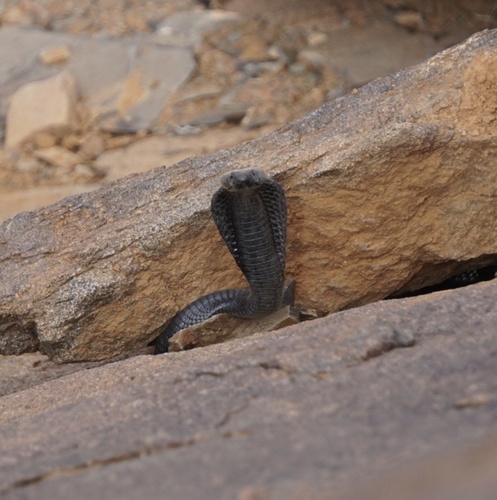
 Black-necked Spitting Cobra
Naja nigricollis

African Striped Skink
Trachylepis striata

 Spotted Bush Snake
Philothamnus semivariegatus

 Puff Adder
Bitis arietans

Johnston's Chameleon
Trioceros johnstoni

 Tropical House Gecko
Hemidactylus mabouia

Brown Forest Cobra
Naja subfulva




Recent sightings in Queen Elizabeth National Park
LIVEiNaturalistAnimal Events
1Kazinga Channel Wildlife Gathering
Concentration of hippos, elephants, buffaloes, and waterbirds along the Kazinga Channel, creating one of Africa’s highest biomass densities per square kilometer.
2Ishasha Tree-Climbing Lion Mating Season
Tree-climbing lions use fig trees (e.g., Ficus natalensis) as vantage points for hunting and socializing, with increased mating activity observed during these months.


3Kob Breeding Concentration in Mweya Peninsula
Large herds of Kob gather in open grasslands for breeding, attracting predators like lions and leopards, creating dramatic wildlife interactions.


Sighting Calendar
Average chance of spotting the park's most-spotted species, month by month
- 1Kazinga Channel Wildlife Gathering
- 2Ishasha Tree-Climbing Lion Mating Season
- 3Kob Breeding Concentration in Mweya Peninsula
Sighting Zones
Warmer areas are where all species together are recorded most often.
Essentials
Climate
What visitors saw
A mother and baby elephant in Uganda Queen Elizabeth Park As we drove through the park on the first day, Hassan spotted two elephants by the side of the road, and slammed on the brakes.
Elephants on Kazinga channel School of hippos Boat trip in Queen Elizabeth National Park Outcast buffalo We also saw two baby crocodiles, some ‘loser’ or outcast male buffalo, kicked out of the herd by younger stronger males, and a variety of birdlife.
We see a herd of buffalo in the distance and then come across a Fisher Eagle and two Hammerkopt birds.
We saw tons of wildlife, including elephants, Cape buffalo, stork, and of course, crocodiles and hippos.
Quick answers
What animals can you see in Queen Elizabeth National Park?
The most likely sightings are African Bush Elephant (seen by about 80% of wildlife watchers), Common Hippopotamus (seen by about 70% of wildlife watchers), Kob (seen by about 70% of wildlife watchers), Waterbuck (seen by about 70% of wildlife watchers), Speckled Mousebird (seen by about 70% of wildlife watchers) — among 1750 recorded vertebrate species, based on citizen-science data from GBIF.
When is the best time to visit Queen Elizabeth National Park for wildlife?
February has the highest combined sighting rate for the park's top species in our month-by-month GBIF data. The full sighting calendar on this page shows each species' best months.
Can you see Lion in Queen Elizabeth National Park?
Yes — about 60% of wildlife watchers report a Lion sighting in Queen Elizabeth National Park, based on 148 verified sightings from GBIF citizen-science data.
Can you see Common Hippopotamus in Queen Elizabeth National Park?
Yes — about 70% of wildlife watchers report a Common Hippopotamus sighting in Queen Elizabeth National Park, based on 236 verified sightings from GBIF citizen-science data.
Can you see African Bush Elephant in Queen Elizabeth National Park?
Yes — about 80% of wildlife watchers report a African Bush Elephant sighting in Queen Elizabeth National Park, based on 278 verified sightings from GBIF citizen-science data.
Can you see Nile Monitor in Queen Elizabeth National Park?
Yes — about 60% of wildlife watchers report a Nile Monitor sighting in Queen Elizabeth National Park, based on 120 verified sightings from GBIF citizen-science data.
Where Wildlife Score
How good is this park for seeing wildlife?Biodiversity
ExcellentHow rich is the wildlife?
Sighting
ExcellentHow likely to see animals?
Experience
ExcellentHow easy and pleasant is the visit?


