Masai Mara National Reserve
🇰🇪 Kenya
🐆 Cheetah Chase During MigrationMasai Mara National Reserve sits in southwest Kenya as a protected expanse of tropical savanna, defined by wide rolling grasslands and scattered acacia trees. Unlike densely forested parks, this open terrain offers unobstructed views across the plains where golden grasses sway in the wind.
-1.442° S 35.091° E
Wildlife
⭐ Iconic Species
 ★
★  Lion
Lion
Panthera leo
 ★
★  Blue Wildebeest
Connochaetes taurinus
 ★
★  Cheetah
Acinonyx jubatus
 ★
★  Leopard
Panthera pardus
📊 Most Spotted

 East African Giraffe
Giraffa tippelskirchi

 African Bush Elephant
Loxodonta africana

 Spotted Hyena
Crocuta crocuta

Topi
Damaliscus korrigum

 Common Hippopotamus
Hippopotamus amphibius

 Plains Zebra
Equus quagga

 Superb Starling
Lamprotornis superbus

 Lilac-breasted Roller
Coracias caudatus

 African Buffalo
Syncerus caffer

 Cape Turtle Dove
Streptopelia capicola

Rüppell's Glossy-starling
Lamprotornis purpuroptera

 Crowned Lapwing
Vanellus coronatus
⭐ Iconic Species
★ Lion
Panthera leo
★ Blue Wildebeest
Connochaetes taurinus
★ Cheetah
Acinonyx jubatus
★ Leopard
Panthera pardus
📊 Most Spotted
East African Giraffe
Giraffa tippelskirchi
African Bush Elephant
Loxodonta africana
Spotted Hyena
Crocuta crocuta
Topi
Damaliscus korrigum
Common Hippopotamus
Hippopotamus amphibius
Plains Zebra
Equus quagga
African Buffalo
Syncerus caffer

Thomson's Gazelle
Eudorcas thomsonii

Impala
Aepyceros melampus

 Common Warthog
Phacochoerus africanus

 Common Eland
Taurotragus oryx

 Banded Mongoose
Mungos mungo
📊 Most Spotted
Superb Starling
Lamprotornis superbus
Lilac-breasted Roller
Coracias caudatus
Cape Turtle Dove
Streptopelia capicola
Rüppell's Glossy-starling
Lamprotornis purpuroptera
Crowned Lapwing
Vanellus coronatus

 Egyptian Goose
Alopochen aegyptiaca

 Common Bulbul
Pycnonotus barbatus

 Common Ostrich
Struthio camelus

 Yellow-throated Longclaw
Macronyx croceus

 White-backed Vulture
Gyps africanus

 Marabou Stork
Leptoptilos crumenifer

Little Bee-eater
Merops pusillus
📊 Most Spotted

 Nile Crocodile
Crocodylus niloticus

 Mwanza Flat-headed Rock Agama
Agama mwanzae

 Nile Monitor
Varanus niloticus

 African Striped Skink
Trachylepis striata

 Leopard Tortoise
Stigmochelys pardalis

 Flap-necked Chameleon
Chamaeleo dilepis

 Helmeted Turtle
Pelomedusa subrufa

 Tropical House Gecko
Hemidactylus mabouia
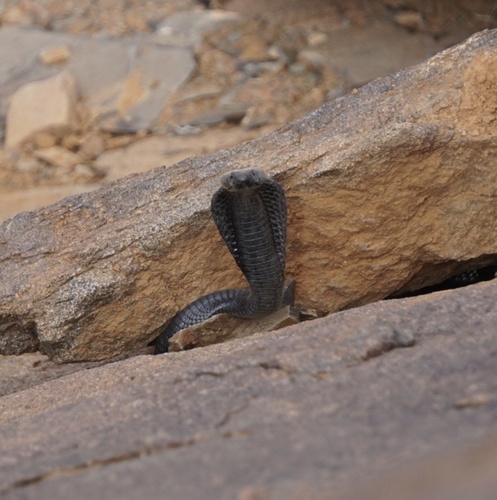
 Black-necked Spitting Cobra
Naja nigricollis

 Gregory's Blue-headed Agama
Acanthocercus gregorii

 Puff Adder
Bitis arietans

 Boomslang
Dispholidus typus
📊 Most Spotted

 Common Reed Frog
Hyperolius viridiflavus

 African Common Toad
Sclerophrys gutturalis

 Anchieta's Ridged Frog
Ptychadena anchietae

 Crowned bullfrog
Hoplobatrachus occipitalis

 Peters' Foam-nest Tree Frog
Chiromantis petersii
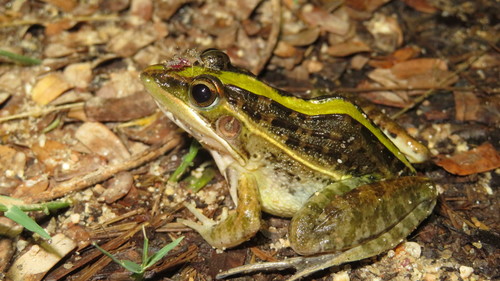
Nile Ridged Frog
Ptychadena nilotica

Senegal Kassina
Kassina senegalensis

 Marsabit Clawed Frog
Xenopus borealis

 Shovel-nosed Frog
Hemisus marmoratus

Red-Banded Rubber Frog
Phrynomantis bifasciatus

Mababe puddle frog
Phrynobatrachus mababiensis

Sharp-nosed ridged frog
Ptychadena oxyrhynchus
Recent sightings in Masai Mara National Reserve
LIVEiNaturalistAnimal Events
1The Great Migration Arrival
Massive herds of blue wildebeest cross the Mara River, braving strong currents and waiting Nile crocodiles in one of nature's greatest spectacles.
2Wildebeest Calving Season
A synchronized birthing period on the short-grass plains that simultaneously triggers intense predation pressure from spotted hyenas and opportunistic plains zebra herds sharing the nursery grounds.
3Mid-Year Predator Peak and Concentration
As dry conditions set in, resident herbivores like African buffalo and territorial topi concentrate near permanent water sources, drawing heightened focus from top-tier predators.
Sighting Calendar
Average chance of spotting the park's most-spotted species, month by month
- 1The Great Migration Arrival
- 2Wildebeest Calving Season
- 3Mid-Year Predator Peak and Concentration
Sighting Zones
Warmer areas are where all species together are recorded most often.
Essentials
Climate
What visitors saw
Before we even arrived at the camp, we saw zebras and gazelles, baboons and wildebeest, and an eland (the largest type of antelope.) Wildlife viewing platform at the Ilkeliani Camp.
As we drove we saw a few of the more common animals like gazelles, zebras, warthogs and ibex, and then came across a beautiful family of giraffes.
After seeing so many animals like the eland, impala, & hyena, we saw our first lion.
Leaving the leopard behind, our guide spotted a couple of hyenas.
Quick answers
What animals can you see in Masai Mara National Reserve?
The most likely sightings are Lion (seen by about 70% of wildlife watchers), East African Giraffe (seen by about 70% of wildlife watchers), African Bush Elephant (seen by about 70% of wildlife watchers), Spotted Hyena (seen by about 60% of wildlife watchers), Topi (seen by about 60% of wildlife watchers) — among 1402 recorded vertebrate species, based on citizen-science data from GBIF.
When is the best time to visit Masai Mara National Reserve for wildlife?
June has the highest combined sighting rate for the park's top species in our month-by-month GBIF data. The full sighting calendar on this page shows each species' best months.
Can you see Lion in Masai Mara National Reserve?
Yes — about 70% of wildlife watchers report a Lion sighting in Masai Mara National Reserve, based on 938 verified sightings from GBIF citizen-science data.
Can you see Blue Wildebeest in Masai Mara National Reserve?
Yes — about 60% of wildlife watchers report a Blue Wildebeest sighting in Masai Mara National Reserve, based on 548 verified sightings from GBIF citizen-science data.
Can you see Cheetah in Masai Mara National Reserve?
Yes — about 60% of wildlife watchers report a Cheetah sighting in Masai Mara National Reserve, based on 476 verified sightings from GBIF citizen-science data.
Can you see Leopard in Masai Mara National Reserve?
Yes — about 50% of wildlife watchers report a Leopard sighting in Masai Mara National Reserve, based on 271 verified sightings from GBIF citizen-science data.
Where Wildlife Score
How good is this park for seeing wildlife?Biodiversity
Very goodHow rich is the wildlife?
Sighting
ExcellentHow likely to see animals?
Experience
Very goodHow easy and pleasant is the visit?


