
Shingleback
Tiliqua rugosa
- KingdomAnimalia (Animals)
- PhylumChordata (Cordats)
- ClassSquamata
- FamilyScincidae (Escíncid)
- GenusTiliqua (Bluetongues)
- SpeciesTiliqua rugosa (Shingleback)
Closest Relatives at Flinders Ranges National Park

Common Bluetongue
Tiliqua scincoides

Flinder's Ranges Rock-skink
Liopholis personata

Tree Skink
Egernia striolata

Boulenger's Snake-eyed Skink
Morethia boulengeri

Gidgee Skink
Egernia stokesii

Eastern Striped Skink
Ctenotus robustus

Ragged Snake-eyed Skink
Cryptoblepharus pannosus

Broad Banded Sand Swimmer
Eremiascincus richardsonii

Common Dwarf Skink
Menetia greyii

Shiny-palmed Shining-skink
Cryptoblepharus australis
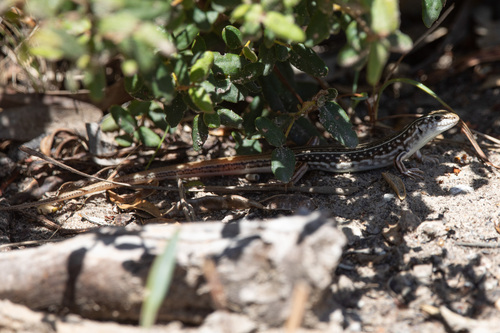
Oriental Ctenotus
Ctenotus orientalis
📅 Monthly Probability
☀️ When They're Spotted
Most active during daytime hours (6am–6pm) · across all parks (global)
Global Distribution
Where this species is recorded worldwide. Restricted to human observations from 2019 onwards — the same kind of record and the same period the probabilities on this page are built from, so collar-tracking studies, camera-trap arrays and museum specimens are excluded. Around Santa Rosa that removes 5,924 GPS fixes from a handful of tagged jaguars.
where this species is recorded (GBIF density — it tracks where observers go, not how likely a sighting is) · parks where it occurs — tap a pin for the sighting probability there
Parks Where Found
| # | Park | Country | Probability |
|---|---|---|---|
| 1 | Grampians National Park | 🇦🇺 Australia | |
| 2 | Flinders Ranges National Park | 🇦🇺 Australia | |
| 3 | Blue Mountains National Park | 🇦🇺 Australia |
Quick answers
What are the chances of seeing a Shingleback in Flinders Ranges National Park?
About 48% of visitor-days record a Shingleback sighting in Flinders Ranges National Park, based on 39 observer-days of citizen-science data from GBIF.
When is the best time to see Shingleback in Flinders Ranges National Park?
October has the highest sighting rate for Shingleback in Flinders Ranges National Park in our monthly data.