



Red-billed Quelea
Quelea quelea
Silhouette: Sheatherius · PhyloPic
- KingdomAnimalia (Animals)
- PhylumChordata (Chordates)
- ClassAves (Birds)
- OrderPasseriformes (Perching Birds)
- FamilyPloceidae (Weavers and Allies)
- GenusQuelea (Queleas)
- SpeciesQuelea quelea (Red-billed Quelea)
About the Red-billed Quelea
The red-billed quelea (Quelea quelea), also known as the red-billed weaver or red-billed dioch, is a small, seasonally nomadic, sparrow-like bird of the weaver family, Ploceidae, native to sub-Saharan Africa. It is approximately 12 cm (4.7 in) long and weighs 15 to 26 g (0.53 to 0.92 oz).
It was named by Linnaeus in 1758, who considered it a bunting, but Ludwig Reichenbach assigned it in 1850 to the new genus Quelea. Three subspecies are recognised, with Q. q. quelea occurring roughly from Senegal to Chad, Q. q. aethiopica from Sudan to Somalia and Tanzania, and Q. q. lathamii from Gabon to Mozambique and South Africa. Non-breeding birds have light underparts, striped brown upper parts, yellow-edged flight feathers and a reddish bill. Breeding females attain a yellowish bill. Breeding males have a black (or rarely white) facial mask, surrounded by a purplish, pinkish, rusty or yellowish wash on the head and breast. The species avoids forests, deserts and colder areas such as those at high altitude and in southern South Africa. It constructs oval roofed nests woven from strips of grass hanging from thorny branches, sugar cane or reeds. It breeds in very large colonies.
The red-billed quelea feeds primarily on seeds of annual grasses, but also causes extensive damage to cereal crops. Therefore, it is sometimes called "Africa's feathered locust". The usual pest-control measures are spraying avicides or detonating fire-bombs in the enormous colonies during the night. Extensive control measures have been largely unsuccessful in limiting the quelea population. When food runs out, the species moves to locations of recent rainfall and plentiful grass seed; hence it exploits its food source very efficiently. It is regarded as the most numerous undomesticated bird on earth, with the total post-breeding population sometimes peaking at an estimated 1.5 billion individuals. It feeds in huge flocks of millions of individuals, with birds that run out of food at the rear flying over the entire group to a fresh feeding zone at the front, creating an image of a rolling cloud. The conservation status of red-billed quelea is least concern according to the IUCN Red List. Wikipedia →
Recent sightings of Red-billed Quelea in Chobe National Park
LIVEiNaturalistClosest Relatives at Chobe National Park

 Red-billed Buffalo-Weaver
Bubalornis niger

Holub's Golden-Weaver
Ploceus xanthops

Southern Masked Weaver
Ploceus velatus
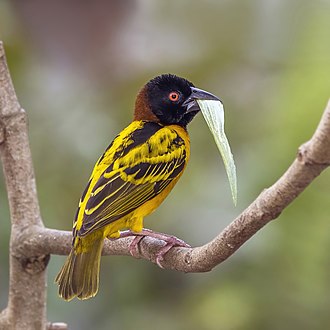
Village Weaver
Ploceus cucullatus

Spectacled Weaver
Ploceus ocularis

Red-headed Weaver
Anaplectes rubriceps

Red Bishop
Euplectes orix

Fan-tailed Widowbird
Euplectes axillaris

Southern Brown-throated Weaver
Ploceus xanthopterus

Lesser Masked-Weaver
Ploceus intermedius

Scaly Weaver
Sporopipes squamifrons

Grosbeak Weaver
Amblyospiza albifrons
Global Distribution
Warmer areas are where this animal is recorded most often.
Parks Where Found
Quick answers
What are the chances of seeing a Red-billed Quelea in Chobe National Park?
About 10% of wildlife watchers report a Red-billed Quelea sighting in Chobe National Park, based on 234 verified sightings from GBIF citizen-science data.
When is the best time to see Red-billed Quelea in Chobe National Park?
February has the highest sighting rate for Red-billed Quelea in Chobe National Park in our monthly data.